Chart Widgets
This page shows an overview of all Chart widget, that are available in the Dashboard for DICOS API Gateway Manager.
This page includes the following widgets:
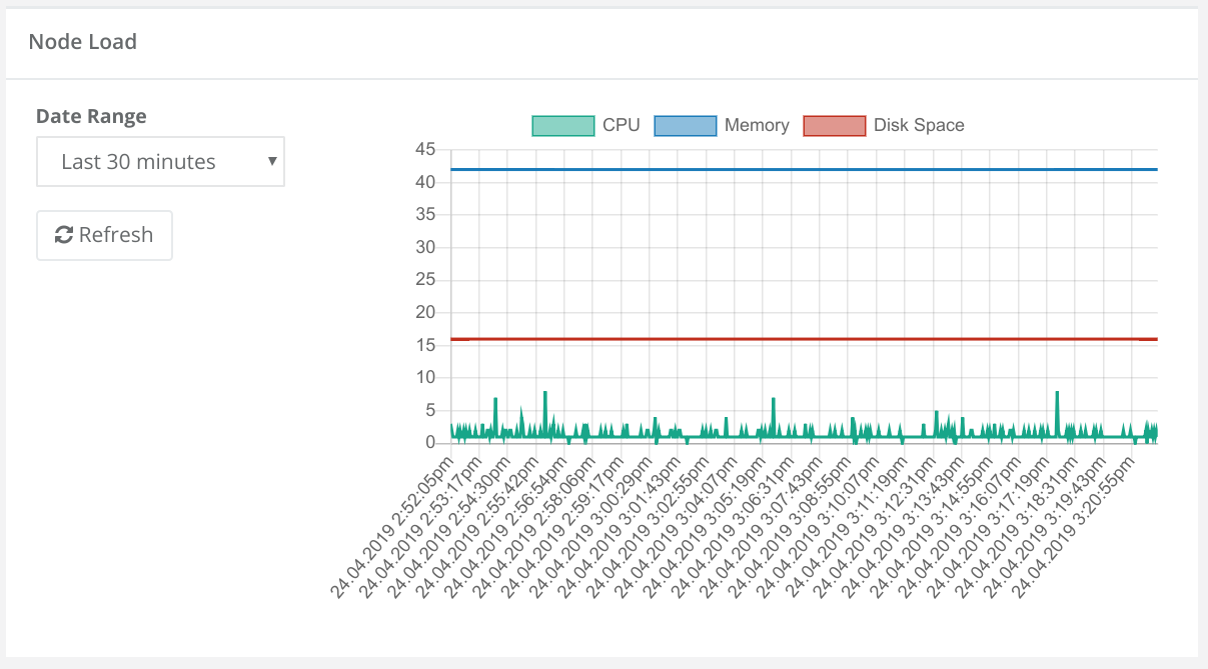
Display CPU, Memory and Disk Space of a Node
Dynamic analytics widget to show CPU, Memory and Disk Space metrics of a specified node.
Edit Mode:
- Choose a Node
Normal Mode:
- Define a date range
- Refresh data
- Select/Deselect metrics
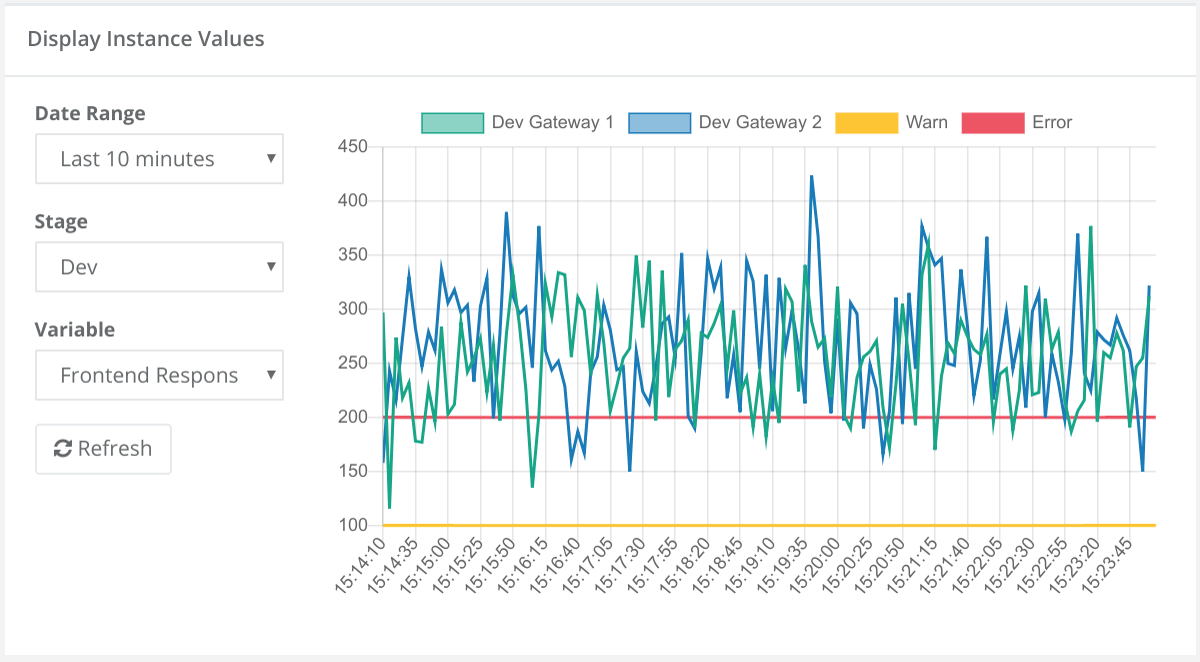
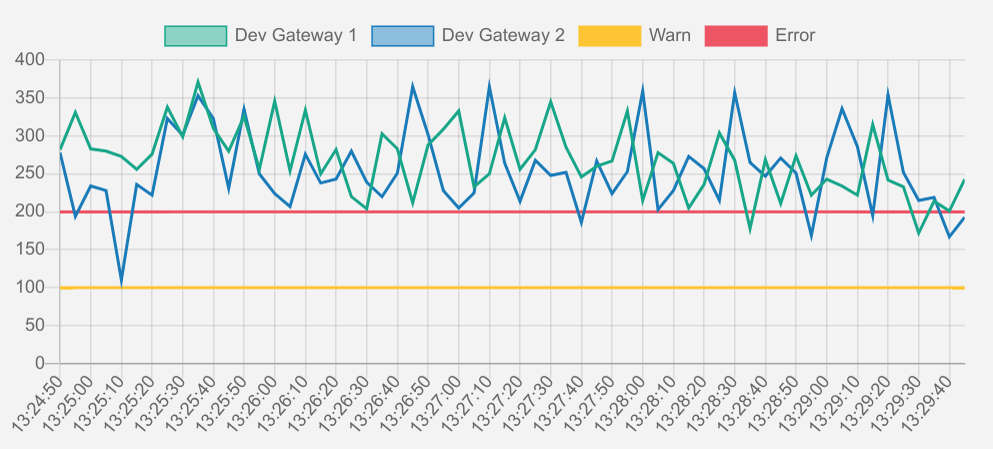
Display values of a chosen variable for all instances of an API
Dynamic analytics widget to show a metric for a specific service, including alarming thresholds.
Edit Mode:
- Choose a Service
Normal Mode:
- Define a date range
- Define a stage
- Choose a metric
- Refresh data
- Select/Deselect a node or an alarming threshold
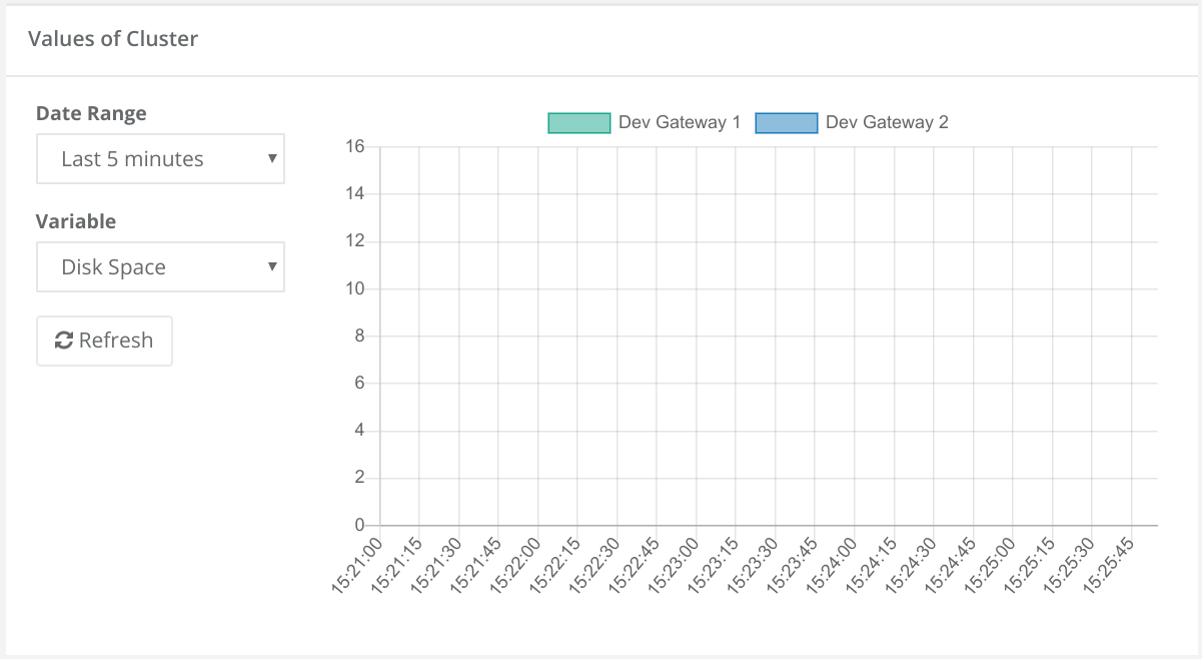
Display values of a chosen variable for all nodes of a cluster
Dynamic analytics widget to show a metric for a specific node.
Edit Mode:
- Choose a cluster
Normal Mode:
- Define a date range
- Choose a metric
- Refresh data
- Select/Deselect a node
Display all information about a variable for all instances of an API
Analytics widget to show a metric for a specific service in a line chart.
Edit Mode:
- Choose a service
- Choose a metric
- Select/Deselect, if min or max values should be shown
- Choose, if alarming thresholds for a specific stage should be shown
Normal Mode:
- Select/Deselect a node or an alarming threshold
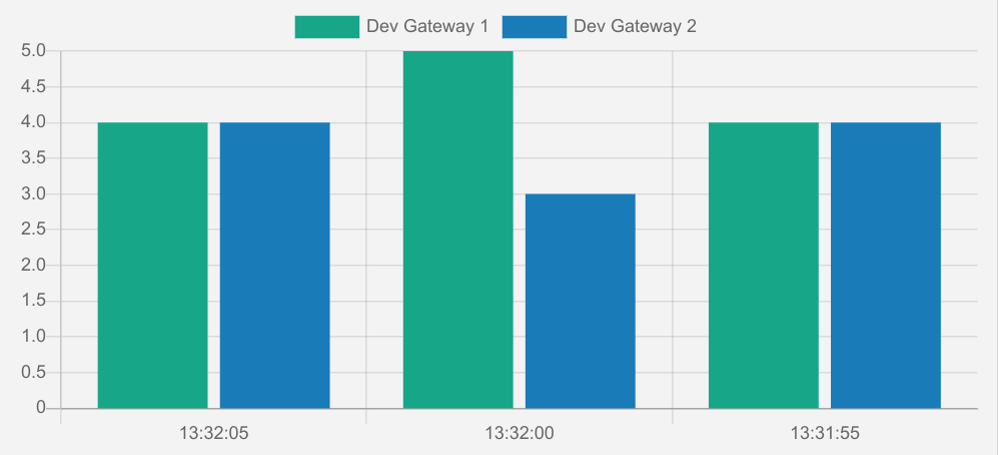
Displaying a bar chart for a variable for all instances of an API
Analytics widget to show a metric for a specific service in a bar chart.
Edit Mode:
- Choose a service
- Choose a metric
- Select/Deselect, if view should be stacked
Normal Mode:
- Select/Deselect a node