Connect an external Prometheus
How it works
AAGM already ships a Prometheus and its Pushgateway.
Installation
Once set up successfully, everything should connect automatically and start collecting metrics from APIs registered in ADAGM.
Here is a diagram of how the individual components work together.
Prometheus Configuration
This configuration is already integrated in the supplied Prometheus.
https://prometheus.io/docs/prometheus/latest/configuration/configuration/
Prometheus automatically pulls the metrics of all its targets every few seconds.
global:
  scrape_interval: 15s

  external_labels:
    monitor: 'codelab-monitor'

scrape_configs:
  - job_name: 'prometheus'
    static_configs:
      - targets: [ 'host.docker.internal:9090' ]

  - job_name: 'aagmdb'
    static_configs:
      - targets: [ 'host.docker.internal:9104' ]

  - job_name: 'prometheus-pushgateway'
    scrape_interval: 1s
    honor_labels: true
    static_configs:
      - targets: [ 'host.docker.internal:9091' ]
Using an external Prometheus
- The url of Prometheus and the Prometheus Pushgateway must be stored in the configuration of DAGM under General settings.
- Prometheus must receive the Pushgateway as target as in line 16 above.
- Optionally, the database of DAGM can also be added. https://grafana.com/oss/prometheus/exporters/mysql-exporter/
View metrics directly in Prometheus
Here are a few examples of how to retrieve metrics directly in Prometheus.
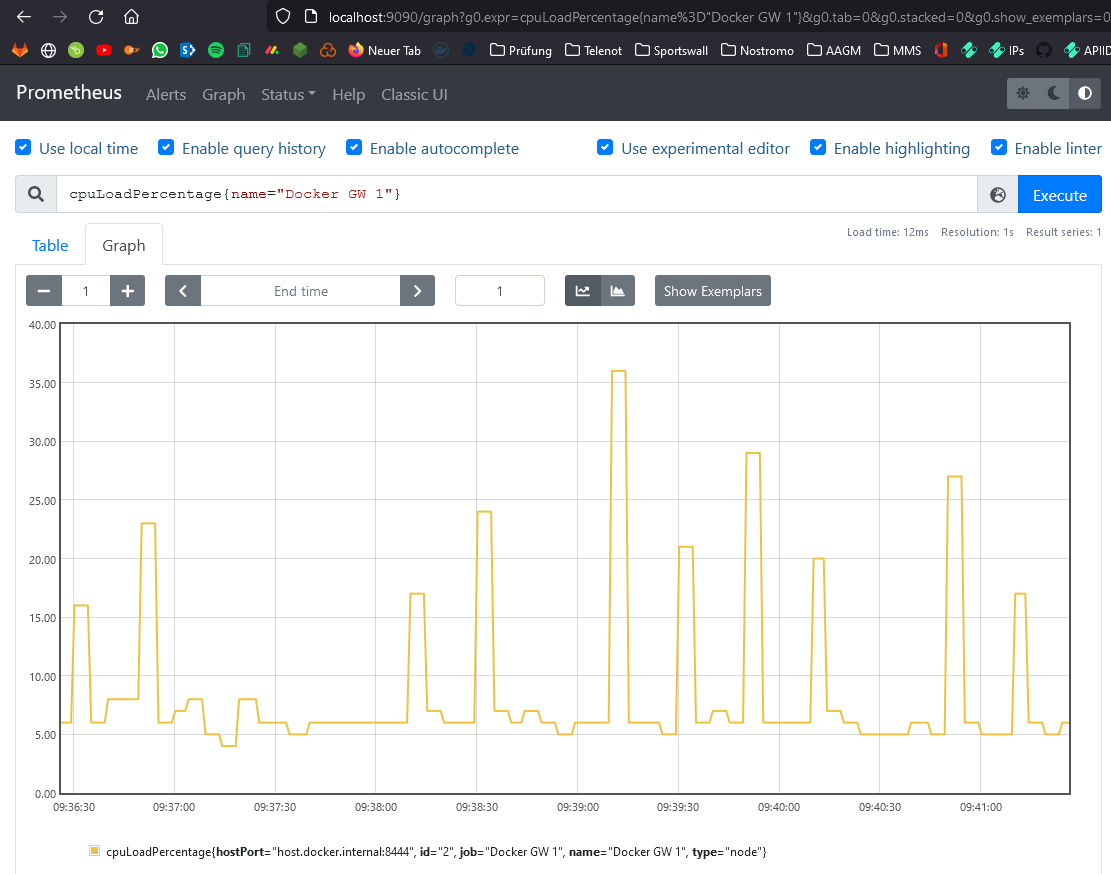
Example: Nodes
- cpuLoadPercentage{name="Docker GW 1"}
- memoryLoadPercentage{hostPort="host.docker.internal:8444"}
- cpuLoadPercentage
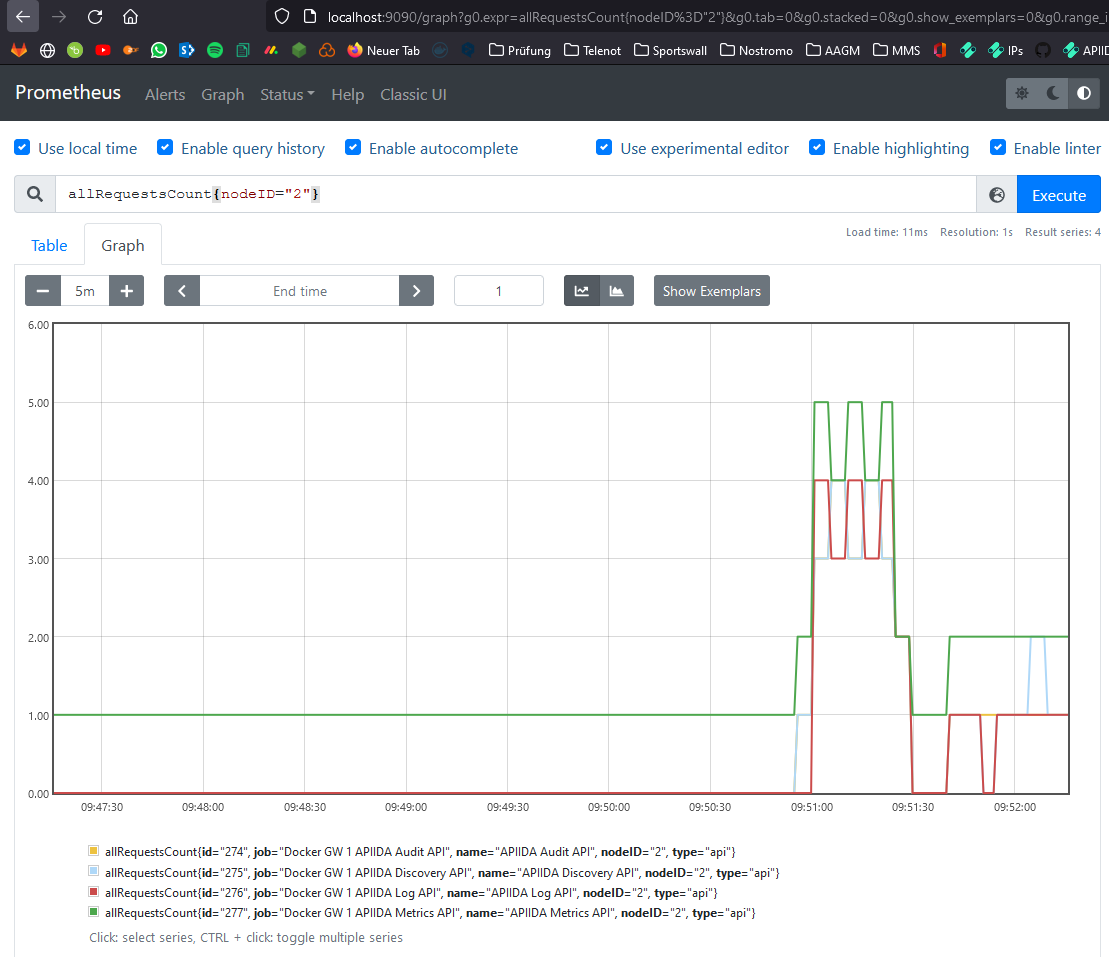
Example: APIs
- allRequestsCount{name="APIIDA Metrics API"}
- allRequestsCount{job="Docker GW 1 APIIDA Metrics API"}
- allRequestsCount{nodeID="2"}
Jobs, Labels and Metric Names
https://prometheus.io/docs/concepts/data_model/#metric-names-and-labels https://prometheus.io/docs/concepts/jobs_instances/
All possible filters can also be viewed here or directly on the PushGateway.
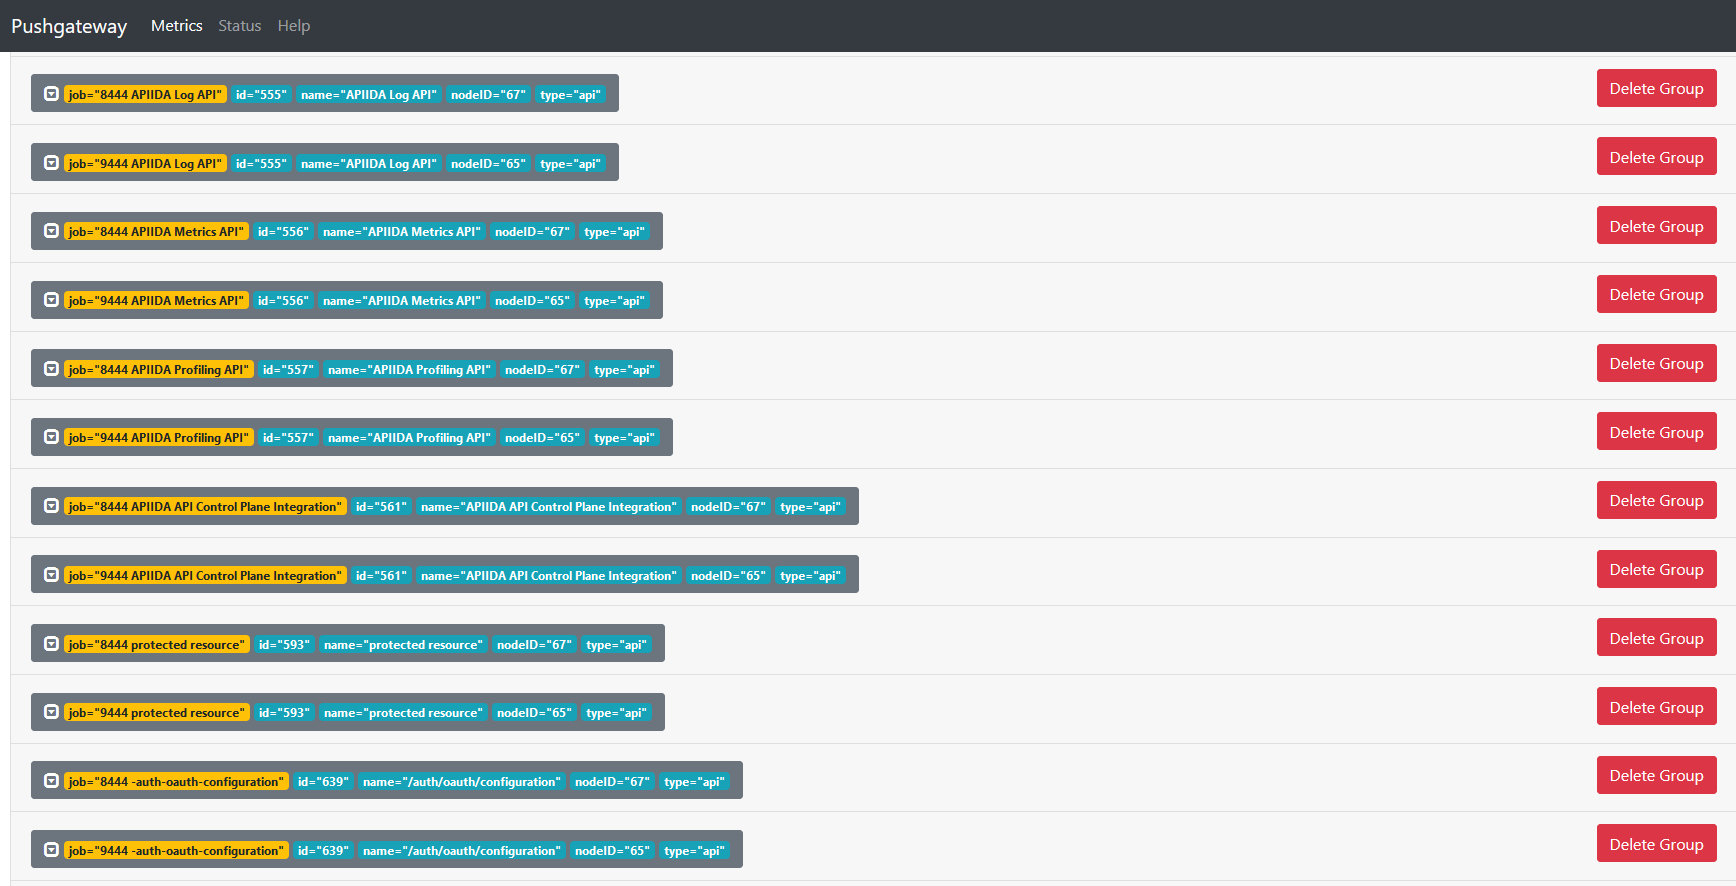
Jobs
The name of the job consists of the name of the gateway and the name of the API.
Labels
Enable the Prometheus dimensional data model to identify any combination of labels for the same metric name.
id- Id of the API or Node
name- Name of the API or Node
nodeId- Id of the node on which the API is running
type- Type of job, either “api” or “node”. Influences which metrics are available.
Metric Names
Specify the general characteristic of a system that is being measured
All Metric Names for Label type=api
allRequestsCountaverageBackendResponseTimeMillisaverageFrontendResponseTimeMillismaxBackendResponseTimeMillismaxFrontendResponseTimeMillisminBackendResponseTimeMillisminFrontendResponseTimeMillispolicyViolationCountroutingFailureCountsuccessfulRequestsCount
All Metric Names for Label type=node
cpuLoadPercentagememoryLoadPercentagediskSpacePercentagetotalDiskSpaceMBfreeDiskSpaceMBsqlDelay
Grafana
Grafana supports the Prometheus query. The Grafana data source for Prometheus is included since Grafana 2.5.0 https://prometheus.io/docs/visualization/grafana/#grafana-support-for-prometheus
Grafana user: admin pass: admin
Links
https://github.com/prometheus/pushgateway
https://packagist.org/packages/promphp/prometheus_push_gateway_php